Gap in FX data via Eikon API

When I run this query:
df, err = ek.get_data(["EUR=", "USD="],["TR.FxRateComposite.date","TR.FxRateComposite"], {'SDate':'2000-01-01', 'EDate':'2020-12-01'})
I notice that there are roughly two years (approx. 2015-2016) of FX data that seems to be wrong. Picture attached. I've tried this with 10+ currencies with the same result. Does anyone know why this is the case?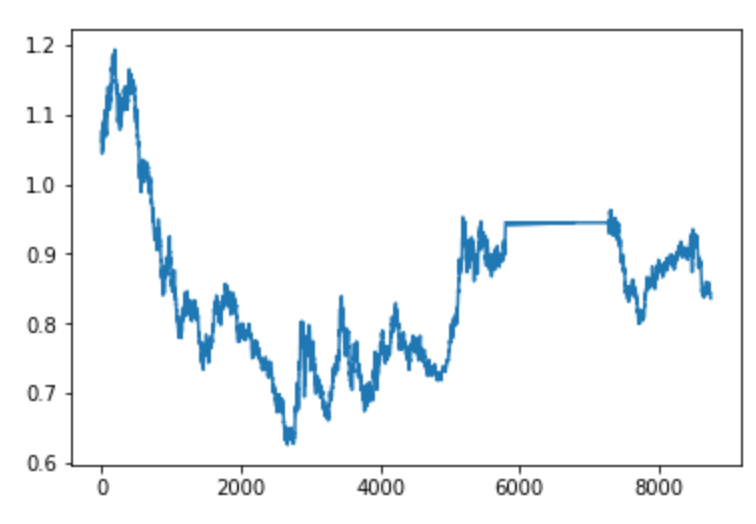
Best Answer
-
Thank you @zoya.farberov for the tip. The gap is not present if I don't request "USD" since the query returns less than 10k data points. Thank you for your help!
0
Answers
-
I'm afraid I'm not reproducing this on my end. On my end
df, err = ek.get_data(["EUR="],
                      ["TR.FxRateComposite.date","TR.FxRateComposite"],
                      {'SDate':'2000-01-01', 'EDate':'2020-12-01'})
df.plot.line(y='FX Rate Last')
produces

One thing I notice is that the number of rows in the dataframe you plot is >8K, whereas the dataframe returned by my code above contains <8K rows. Could you check how you get the rows corresponding to the flat line in your plot? Are they returned by get_data method? If yes, would you mind including the exact get_data call that returns the dataframe with suspect data and export the values in the dataframe to a CSV file, zip it and attach it to your post?
1 -
Hello @christoph.b,
I do not reproduce this on my side.
I can think of two possible causes, one is you may be hitting around 10K datapoints limit. See Eikon Data API Usage and Limits Guideline for more detailed info on this.
Suggest removing USD=, it does not seem to yield value, as is always 1.0

See if this helps.
The other, something may be off with charting, I do not see dates, try this:

See if it helps?
1

Categories
- All Categories
- 6 AHS
- 37 Alpha
- 161 App Studio
- 4 Block Chain
- 4 Bot Platform
- 16 Connected Risk APIs
- 47 Data Fusion
- 30 Data Model Discovery
- 608 Datastream
- 1.3K DSS
- 577 Eikon COM
- 4.9K Eikon Data APIs
- 7 Electronic Trading
- Generic FIX
- 7 Local Bank Node API
- Trading API
- 2.7K Elektron
- 1.3K EMA
- 236 ETA
- 519 WebSocket API
- 33 FX Venues
- 10 FX Market Data
- 1 FX Post Trade
- 1 FX Trading - Matching
- 12 FX Trading – RFQ Maker
- 5 Intelligent Tagging
- 2 Legal One
- 20 Messenger Bot
- 2 Messenger Side by Side
- 9 ONESOURCE
- 7 Indirect Tax
- 59 Open Calais
- 264 Open PermID
- 39 Entity Search
- 2 Org ID
- PAM
- PAM - Logging
- 8.4K Private Comments
- 6 Product Insight
- Project Tracking
- ProView
- ProView Internal
- 20 RDMS
- 1.4K Refinitiv Data Platform
- 367 Refinitiv Data Platform Libraries
- 3 Refinitiv Due Diligence
- LSEG Due Diligence Portal API
- 3 Refinitiv Due Dilligence Centre
- Rose's Space
- 1.1K Screening
- 18 Qual-ID API
- 13 Screening Deployed
- 23 Screening Online
- 10 World-Check Customer Risk Screener
- 990 World-Check One
- 44 World-Check One Zero Footprint
- 45 Side by Side Integration API
- Test Space
- 3 Thomson One Smart
- 1.2K TR Internal
- Global Hackathon 2015
- 2 Specialists Who Code
- 10 TR Knowledge Graph
- 150 Transactions
- 142 REDI API
- 1.7K TREP APIs
- 4 CAT
- 21 DACS Station
- 117 Open DACS
- 1.1K RFA
- 103 UPA
- 172 TREP Infrastructure
- 224 TRKD
- 886 TRTH
- 5 Velocity Analytics
- 5 Wealth Management Web Services
- 59 Workspace SDK
- 9 Element Framework
- 5 Grid
- 13 World-Check Data File
- Yield Book Analytics
- 46 中文论坛